Performance
Calendar views and statistics for tracking your results.
Trade Calendar
See your activity at a glance.
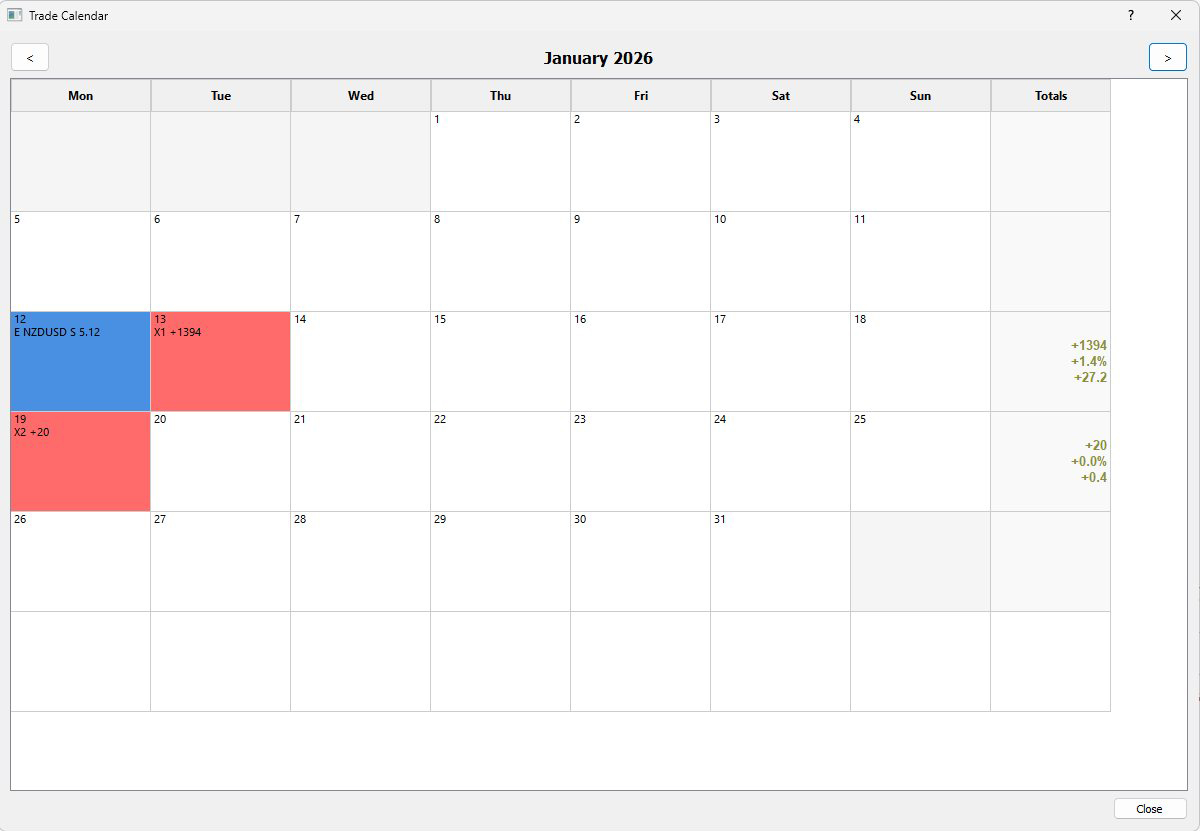
Click the Trade Calendar button to view your trades by date. Blue cells mark entries, red cells mark exits. The weekly totals column on the right shows dollar P/L, percentage gain, and pip P/L.
Click any day's cell to open Trades Manager filtered to that date for a detailed review.
Green numbers indicate profitable weeks, red indicates losing weeks. Compare across weeks to identify your best trading days, overtrading periods, and consistency patterns.
Statistics
Comprehensive performance metrics.
Click the Statistics button to open the full analysis panel.
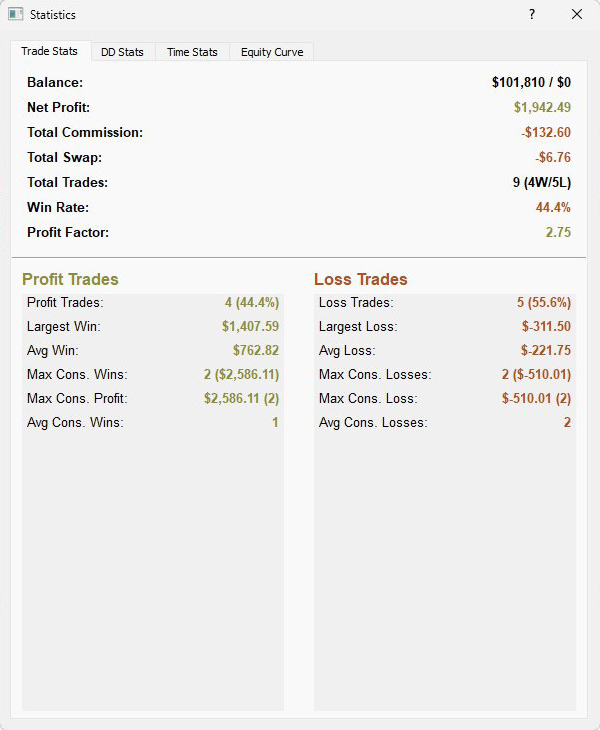
Trade Stats shows win rate, profit factor, average win versus average loss, and streak data for consecutive wins and losses.
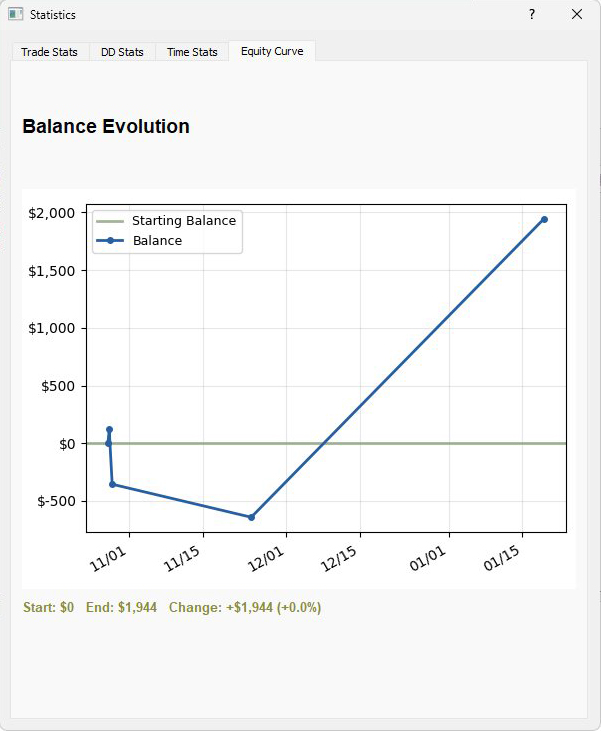
Equity Curve displays your balance progression over time with drawdown periods and recovery patterns clearly visible.
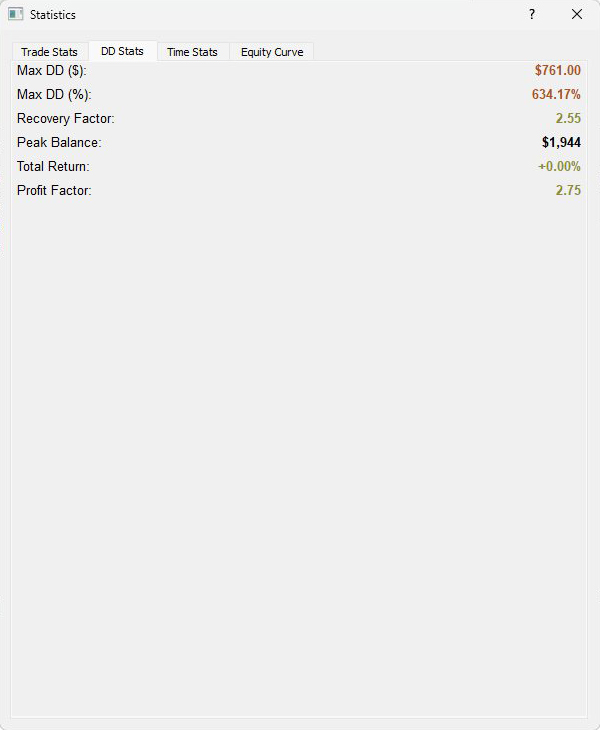
DD Stats breaks down maximum drawdown, current drawdown, and recovery factor.
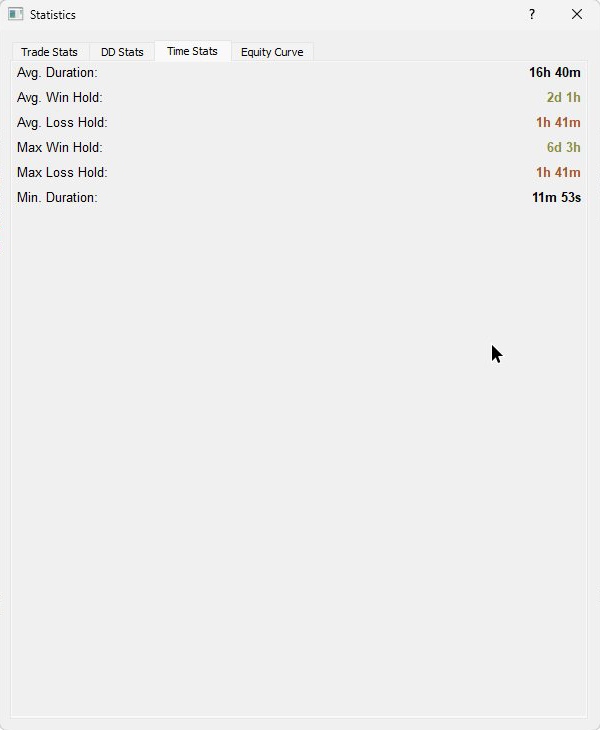
Time Stats reveals average trade duration and your best and worst trading hours and days.
Filtering for Strategy Analysis
Isolate specific setups to measure what works.
In Trades Manager, click the Tags tab in the left panel. Select a tag like "breakout" and toggle Show Filtered Stats on. The stats header now shows performance for only those trades.
Compare strategies by filtering each tag separately and noting the win rates. Combine filters for deeper analysis - symbol plus tag for "EURUSD breakouts only", or time plus tag for "reversals this month".
Spot something off? Open an issue