Customization
Adjust colors, stats display, and calendar modes.
Color Scheme
Make the interface easier on your eyes.
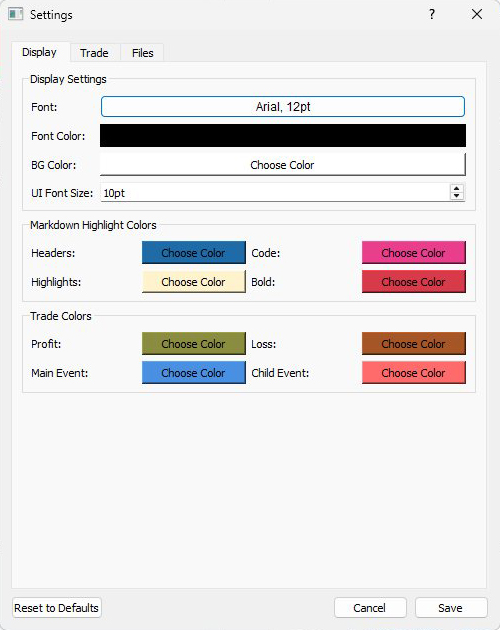
Open Settings and go to the Display tab. Adjust background color, font color, and markdown highlights for your preferred contrast. Under Trade Colors, customize profit and loss indicators - change from the default olive and orange to bright green and red if you prefer.
Click Save and the entire app reflects your color preferences.
Stats Dashboard
Show only the metrics you care about.
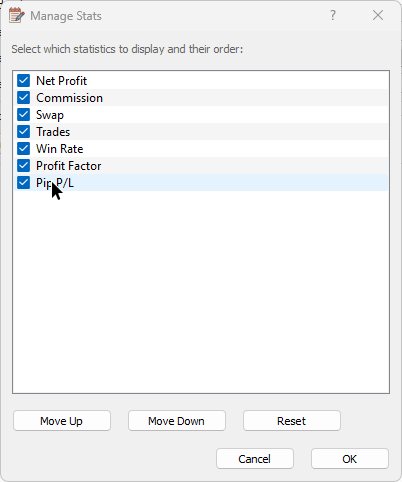
Open Settings and go to the Trade tab. Click Manage Stats to open the Stat Manager dialog. Uncheck stats you don't need like swap costs, check ones you want like max drawdown. Drag to reorder with the most important metrics on the left.
Click OK, then Save. The Trades Manager header now shows your customized stats in your preferred order.
Calendar Mode
Choose how trades display across days.
Open Settings, go to the Trade tab, and change Calendar display mode.
Transaction mode shows only the final exit day with total P/L - simpler for day traders.
Evolution mode shows trade progression across days. Entry day displays as "E EURUSD B 2.5" (Entry, Buy, 2.5 lots). Partial exits show as "X1 +500" and "X2 +300" on their respective days - better for swing and position traders who want to see the holding pattern.
Spot something off? Open an issue